01
Black-box predictions
A prediction can rank risk without clarifying which intervention might change the outcome.
aitiolin is a browser-based interface for interactive DAG building, identification analysis, causal effect estimation, robustness testing, and time-series causal analysis. It helps users move from “what correlates with churn?” to “what may happen if we actually change something?” in a transparent, non-production setting.
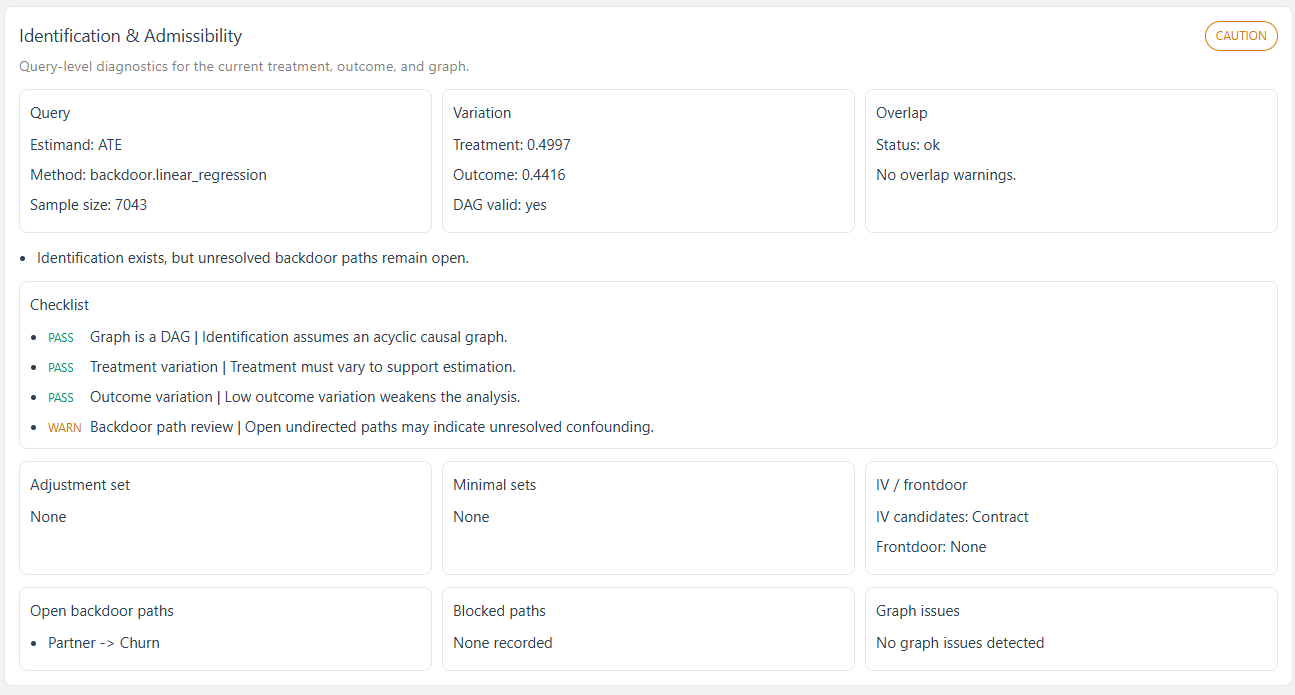
Backdoor paths, admissibility checks, and adjustment sets.
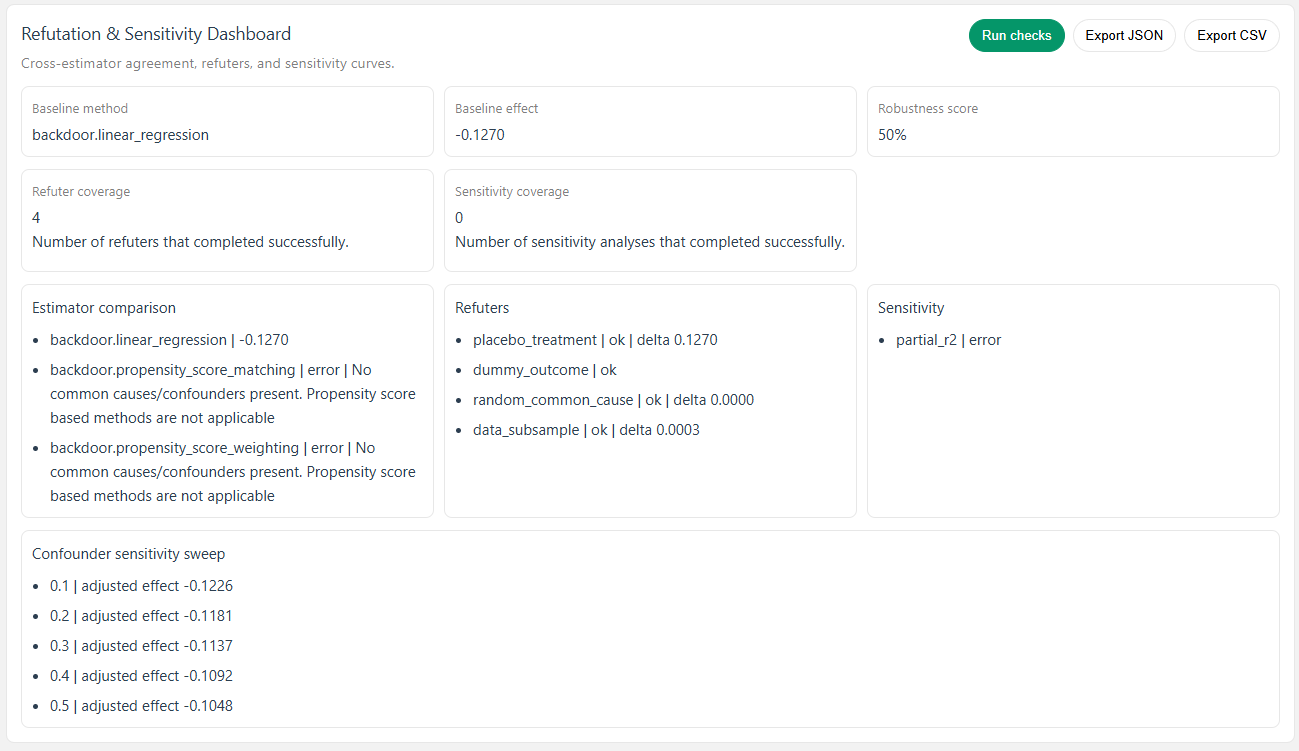
Parallel estimators, placebo tests, subsamples, and sensitivity sweep.
Many AI projects produce scores without clearly showing why a result appears or whether the underlying assumptions are defensible. For private users and researchers, that makes intervention reasoning harder, not easier.
A prediction can rank risk without clarifying which intervention might change the outcome.
Any intervention strategy needs a causal question: what happens if we change pricing, support, or retention spend?
Visual graphs allow domain experts, analysts, and other reviewers to examine assumptions together.
Instead of stitching together multiple libraries and notebooks, this open-source prototype concentrates graph drafting, identification, estimation, and robustness into a single browser-based workflow for private use.
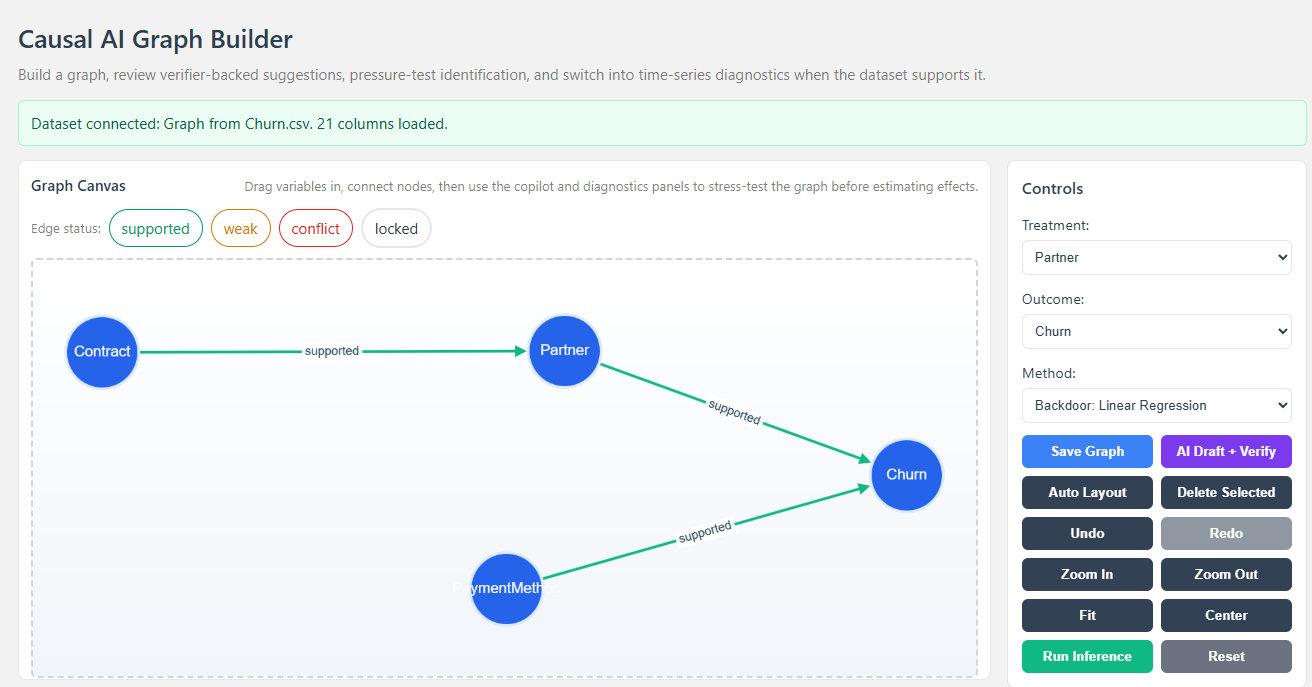
Drag variables onto a canvas, create directed edges, and persist graph state across sessions.
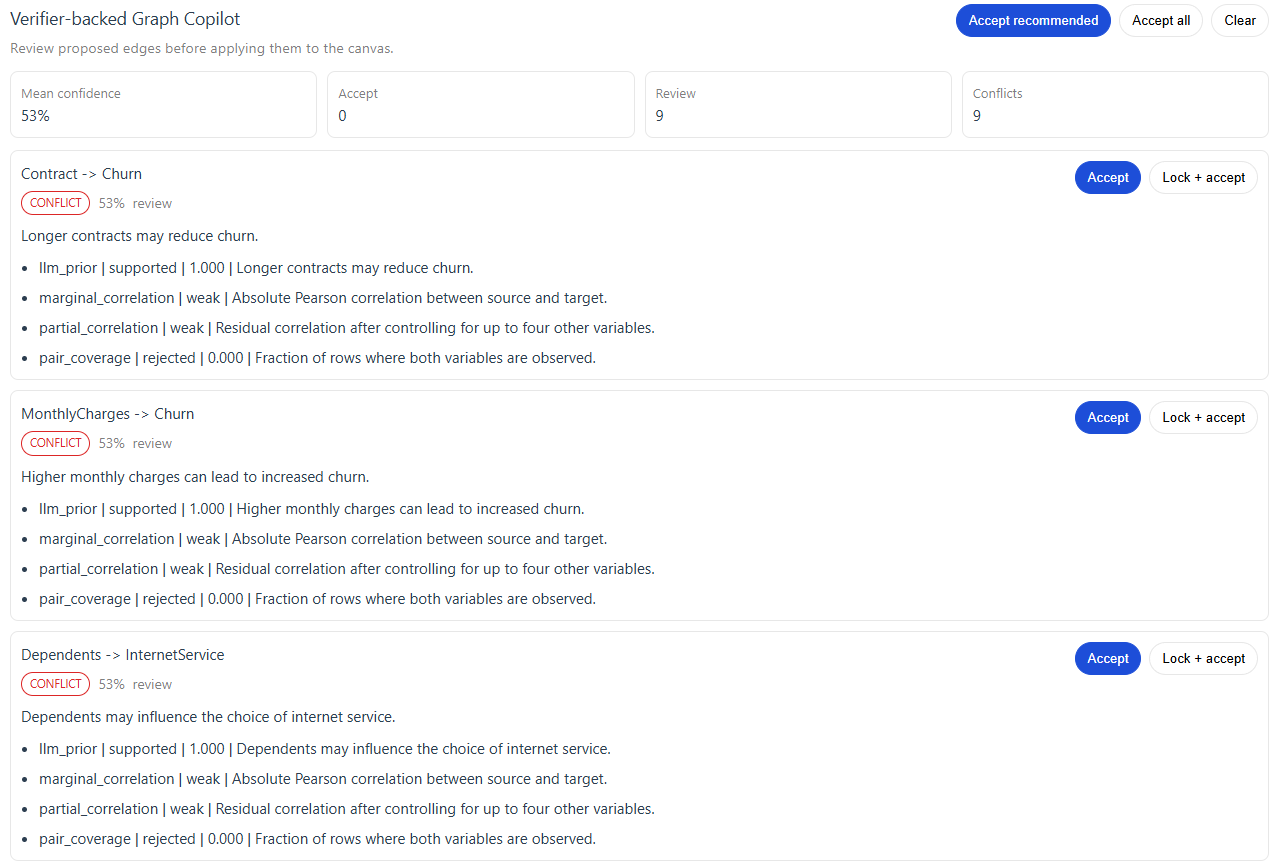
Get AI-assisted edge suggestions with reviewable evidence and accept/reject decisions.
Check DAG validity, admissibility, adjustment sets, and candidate identification strategies.
Run estimators such as linear regression, propensity score matching, and weighting.
Compare estimators, inspect refutations and sensitivity, and review alternative causal models. The summary score is secondary.
Analyze rolling-window stability where a time dimension is available.
The workflow is structured so users inspect assumptions before effect estimation and robustness before interpretation.
Start with a bundled example, or upload a CSV to your running Django server.
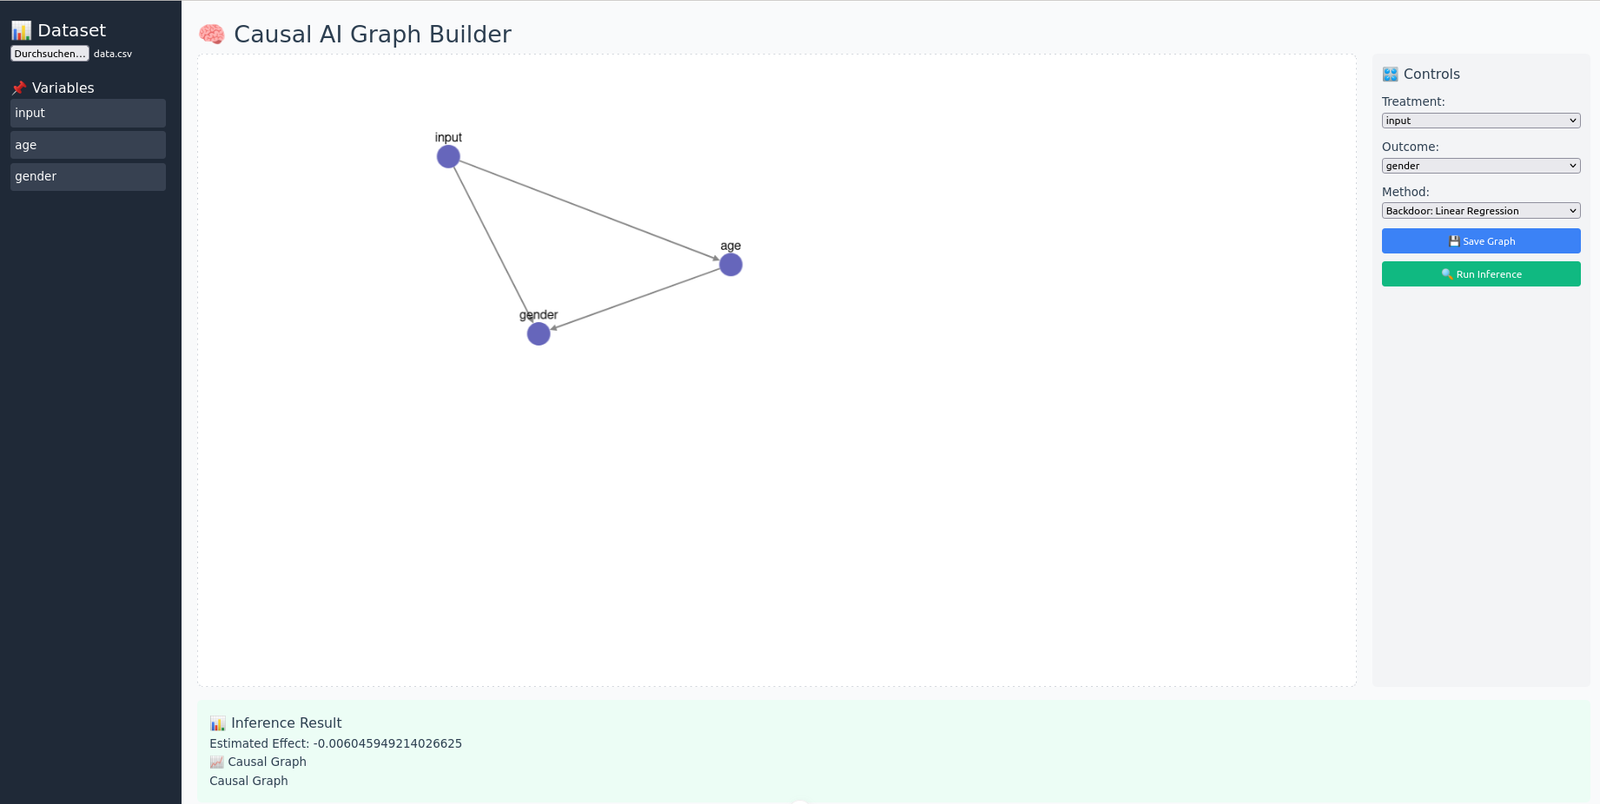
Place nodes on the canvas and draw directed edges.
Use local heuristics, or preview and approve each external LLM request. Review every proposed edge.
Validate whether the treatment–outcome question is answerable.
Specify the intervention question you want to analyze.
Run one or more estimators against the causal query.
Inspect placebo tests, dummy outcomes, subsamples, and sensitivity.
Save a run bundle with assumptions, versions and evidence. Use it for learning, not operational decisions.
This page is an introduction, not a hosted analysis service. Start the updated Django backend and Vue frontend from the repository instructions. In the application, choose Try a sample and load Telco churn or World Bank health spending. No account or LLM key is required for sample loading.
Review the preset graph and limitations, estimate the effect, then inspect diagnostics and alternative models. Use Reproducibility exports to save the latest recorded stage as JSON or ZIP. Dataset files and row previews are excluded; column names and analysis metadata can still be sensitive.
CSV processing is server-side and is local only when the server runs on your own computer. The privacy panel explains storage, reviewed external requests, retention and Delete session data. Closing a tab alone does not delete server files.
Compact demonstrations of the prototype workflow, from a causal question to estimation and robustness review. They are provided for learning and are not business, policy, or medical recommendations.
Examines whether longer contracts may reduce churn after accounting for customer differences such as tenure. The walkthrough covers the DAG, adjustment, estimation, refutation tests, and sensitivity.
Explores whether higher health spending relates to lower child mortality after accounting for GDP and region, and shows how functional form and panel data can change interpretation.
aitiolin is developed as an open-source prototype for private experimentation and learning, not for autonomous or operational decision-making. The graph, identification logic, and robustness checks are visible and reviewable.
The causal graph makes structural assumptions visible instead of hiding them in a black-box score.
Edge suggestions can be reviewed, accepted, locked, or rejected by a human user.
The dashboard encourages stress-testing before drawing conclusions from an estimate.
Repository updates for private experimentation and learning. Source version: 0.1.0-prototype.1.
This is an experimental source update, not a production release, security certification or validation of causal conclusions.
The staged assistant added data profiling, reviewable cleaning, model suggestions, and competing-DAG comparison. In the current version, external LLM requests require explicit enablement and payload approval.
aitiolin is an open-source prototype for transparent causal exploration and hypothesis development. It is intended for private use, experimentation, and learning, not for production or business decision workflows.